Where AI is used, hiring has slowed.

Justin Strharsky
Head of Research, AITAI
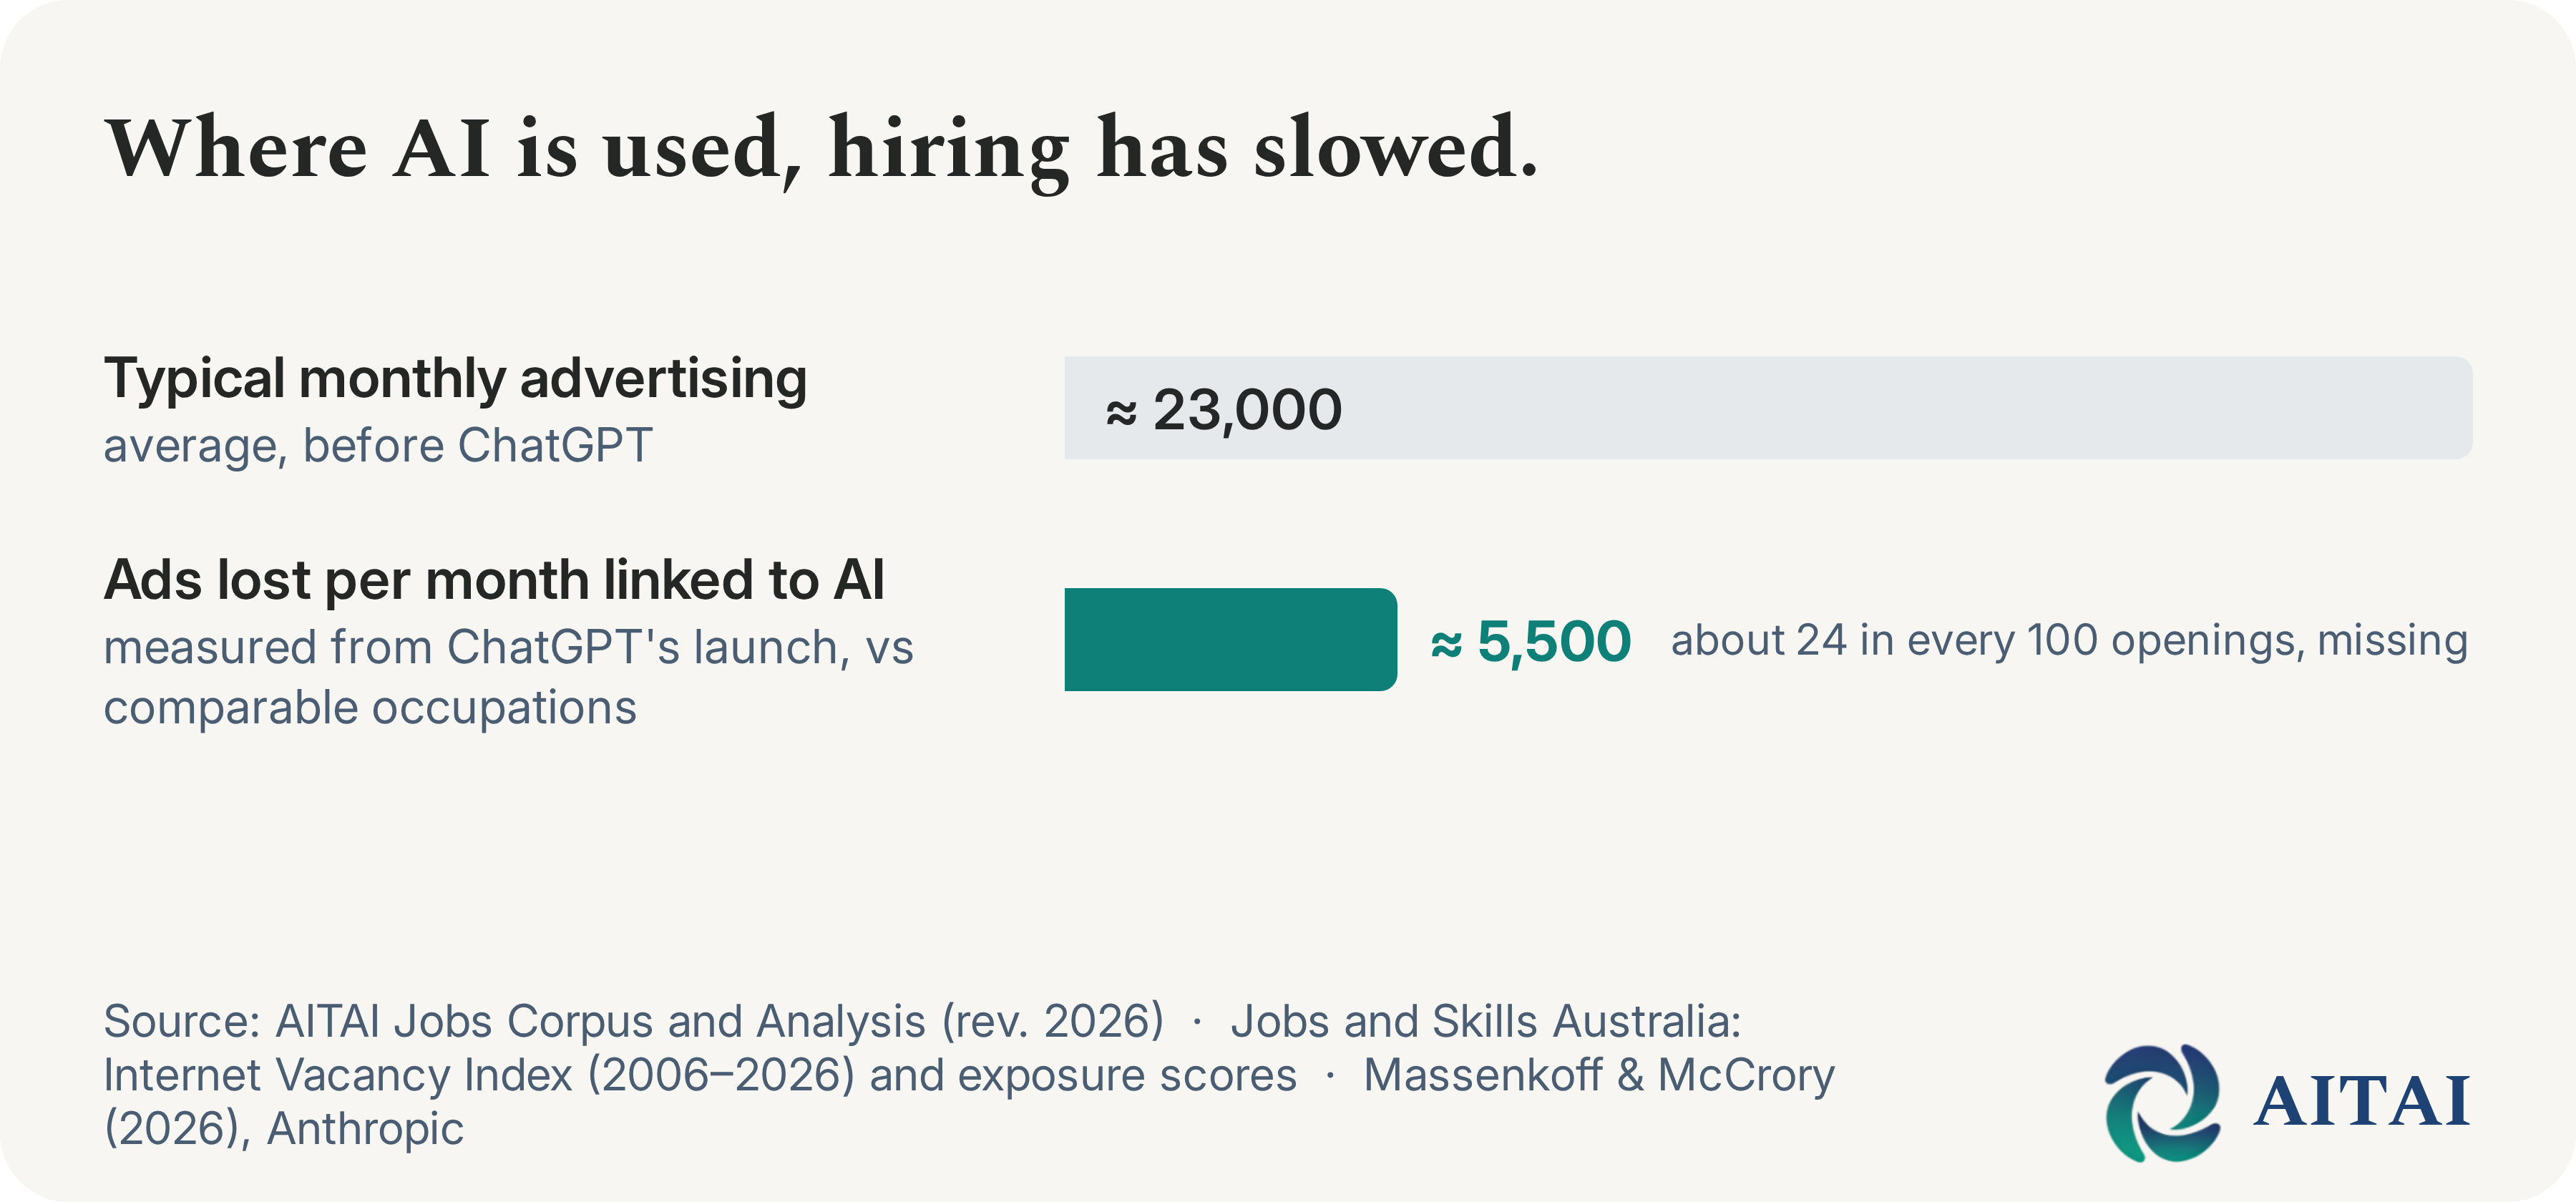
Where AI is used, hiring has slowed.
Correction and revision (September 2026): This article has been revised in two ways following our own replication and sensitivity testing. First, the original version understated the size of the hiring shortfall: our headline estimate of roughly 390 fewer advertisements a month is measured per occupation, but we compared it against the combined advertising of all 14 occupations, which made the effect look far smaller than it is. Measured correctly, the 14 occupations together are posting around 5,500 fewer advertisements a month, roughly 24 in every 100 they posted in a typical month before ChatGPT, not "one or two in every 100" as originally stated. Second, this revision refines how we describe the timing of the effect: additional testing shows the divergence began before ChatGPT's launch and has widened steadily since, rather than starting in late 2022. No statistical estimate, significance test or robustness check is affected by the units error, which was in how we described the number, not in the analysis. We found both issues through routine replication of our own work.
AI is starting to show up in Australia's job ads. We compared job advertisements for occupations where AI is actually being used; jobs like software programmers, analysts and call centre workers, against similar occupations where it isn't. The AI-using occupations began losing ground around mid-2021, before ChatGPT made AI a household topic, and the gap has widened steadily since. Measured from ChatGPT's launch in November 2022, these occupations are now advertising around 5,500 fewer openings a month than their counterparts. That gap is too large to be chance.
How big is that? These 14 occupations advertised around 23,000 openings a month between them in a typical month before ChatGPT. A shortfall of roughly 5,500 a month means that for every 100 openings they would normally have posted, about 24 are now missing. That is a large effect inside the affected occupations: roughly a quarter of their normal hiring. Across the whole labour market, the same shortfall is small: Australia posts around 285,000 job advertisements a month, so the gap amounts to about 2% of national advertising. For comparison, the broader economic downturn removed around 74,000 advertisements a month between 2022 and 2025. The economy has still moved more jobs than AI has, but the difference is a factor of about 14, not hundreds. In short: a small share of the national job market, but significant inside the jobs where AI is used..
Three things this finding is not. It is not proof that AI alone caused the gap. These occupations overlap heavily with a tech sector that had its own hiring downturn over the same period, and our data cannot fully separate the two. It is not a ChatGPT shock: the slide was under way more than a year before ChatGPT launched, which points to a gradual change, possibly reflecting earlier AI tools already spreading through these workplaces, rather than a single moment of disruption. And it is not job losses: employment in these occupations has continued growing. The signal is slower hiring, not firing. That is the earliest form a labour-market shift can take, which is exactly why it is worth watching.
WA accounts for roughly one in nine advertised vacancies nationally in our dataset, but appears to hold a smaller share (closer to one in fourteen) of vacancies in the occupations where AI is used. Much of the gap between the two estimates is therefore scale: WA simply has proportionally fewer of these roles. Additionally, a labour market anchored in mining and resources may have less of these AI usage roles, although that needs testing. Where the roles do exist, the slowdown is statistically detectable and consistent in strength with the national one, though it clears a lower evidentiary bar than the national result.
The federal government's first report on AI and employment, released last month by DEWR, points the same way: modest slowing in exposed occupations, no upheaval. Our analysis looks earlier in the pipeline: at hiring rather than headcounts, which is where we would expect the first signs of impact to show up.
Fine print: Difference-in-differences on Internet Vacancy Index data to February 2026. The IVI counts online job advertisements from major recruitment platforms, published as a 3-month moving average, so figures are advertised online vacancies rather than total vacancies, and estimates are relative to the comparison group rather than counts of jobs lost. We compare 14 occupations with observed AI use against 73 occupations predicted to be AI-exposed but with lower observed use (the comparison list is published in the report appendix), before and after November 2022, with a pre-period of March 2006 to October 2022. National: 391 fewer advertised vacancies per treated occupation per month, about 5,500 across the group, p = 0.005 under this specification; shorter baselines give smaller estimates (around 290 to 300) with weaker significance. WA: 32 fewer per treated occupation, about 450 across the group, p = 0.014, negative in all 1,000 bootstrap resamples though not significant under the matched bootstrap, our strictest test. The result is the headline estimate plus six robustness checks, including leave-one-out tests: excluding the largest contributor, software programmers, still leaves a significant gap of around 300 per occupation. Timing: we date the comparison from ChatGPT's public launch as a convention; the divergence in fact began around mid-2021 and estimates are negative and significant wherever within six months of that date we draw the line, so the data supports a sustained slide rather than a sharp break, and it cannot fully separate early AI diffusion from the tech hiring cycle that turned at the same time. Figures reflect a July 2026 correction to the occupation crosswalk and a September 2026 correction to the units in which the headline figure is described. Observed use is measured from US Claude usage data mapped to Australian occupations via the ONET task taxonomy (Massenkoff & McCrory 2026); it proxies US rather than Australian adoption, and any resulting misclassification biases the estimate toward zero. DEWR's AI and Employment in Australia provides the national employment-side benchmark; its job-advertisement model variant, run against predicted exposure, found no significant effect. Source: AITAI Jobs Corpus and Analysis (rev. 2026).*